Distributed Pricing Service
A front-office analytics platform in miniature: a C++ pricing and exposure library behind a Python service, books and risk runs spread across Kubernetes worker pools, Redis and Cassandra underneath, managed in Rancher, observed end to end, and run through chaos tests that kill pods, databases and whole nodes.
Built for a core engineering role
The role supports a distributed analytics library used for front-office pricing, triages issues intraday and routes them to the right team, works with support teams on the environment, and reviews the architecture for performance. Each of those has a concrete counterpart here:
| The job | In this project |
|---|---|
| Support a distributed analytics library for front-office and intraday pricing | C++20 library (Monte Carlo and closed forms) behind /price, intraday books on a worker pool, batch exposure/CVA runs on another |
| Triage intraday and route to the right team | tools/triage.py, alerts carrying an owner label routed by Alertmanager, a runbook with 14 real incidents |
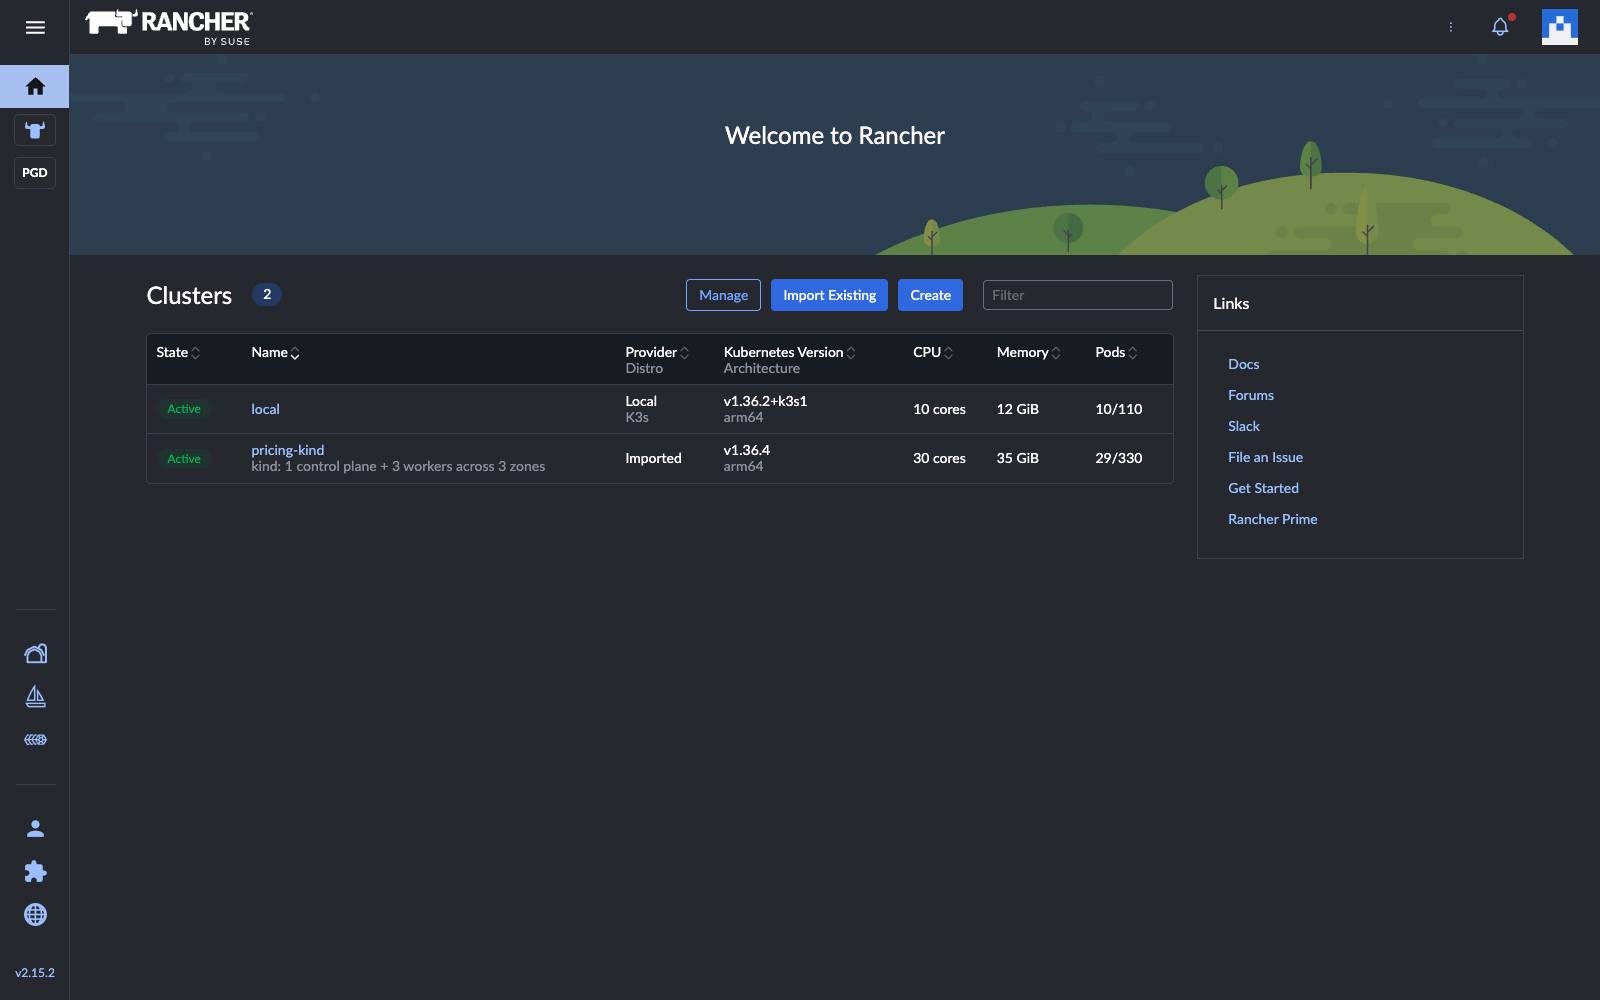
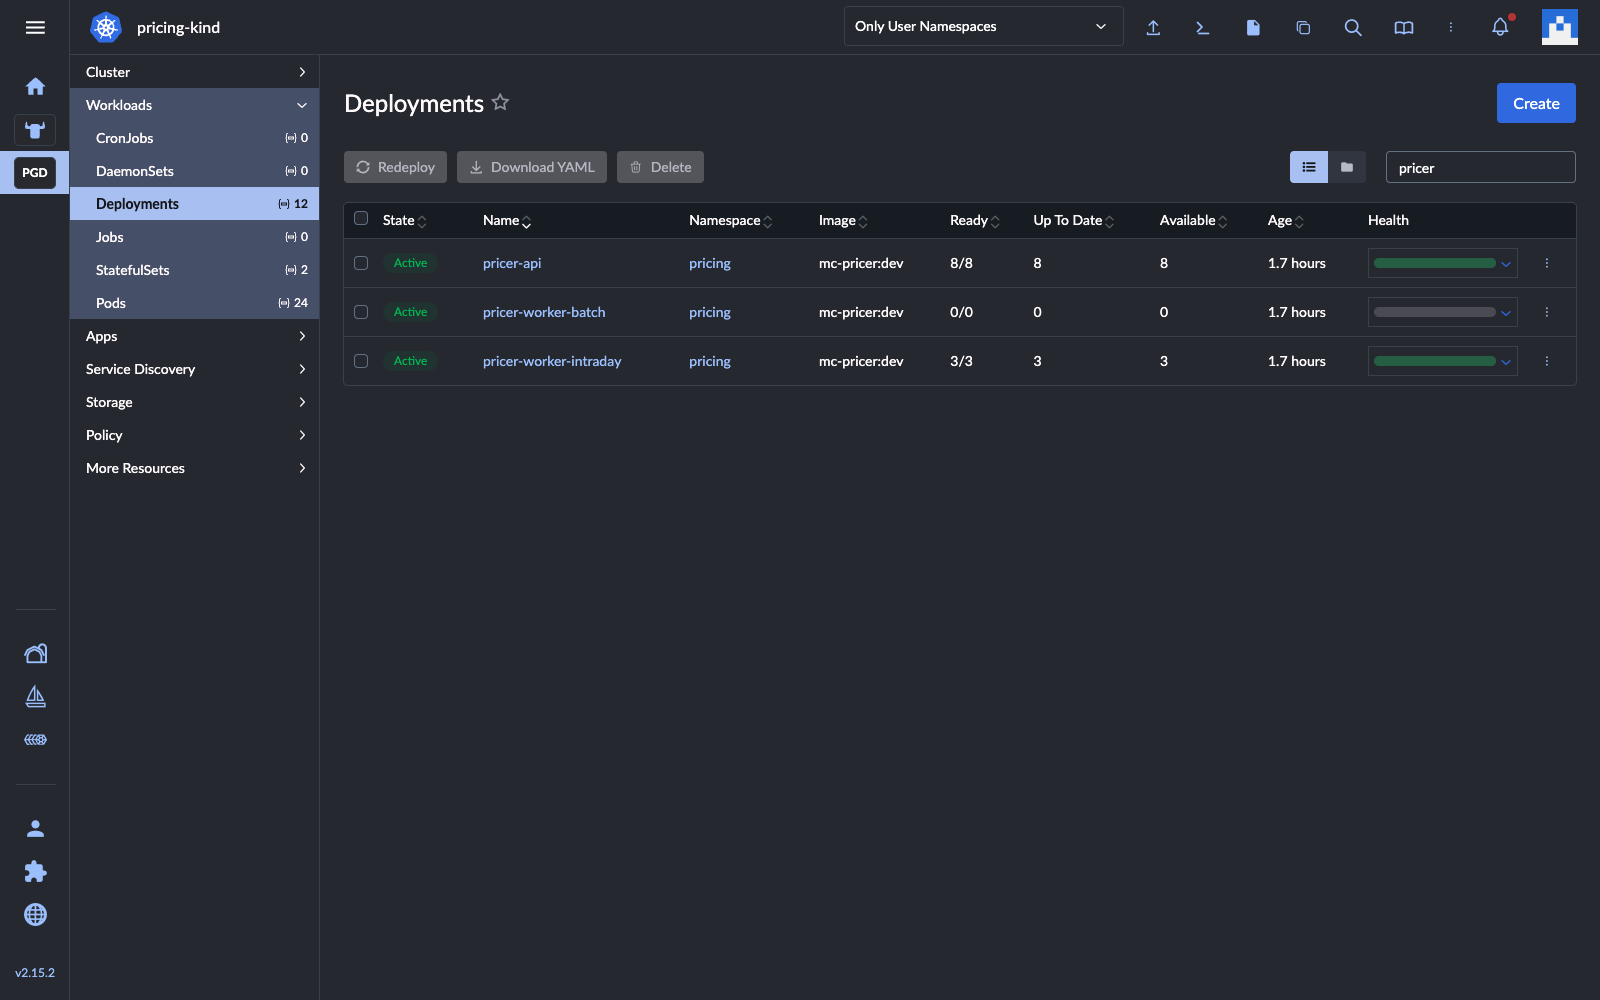
| Manage the environment with support teams | Kustomize base and overlays, Rancher managing the cluster, SLOs and dashboards shared with owners |
| Review the architecture, propose performance improvements | A performance review: every change measured before and after, three of my own hypotheses disproved |
| Kubernetes, Docker, Rancher · Redis, Cassandra · Python, C++ | All in use, each for the job it suits (below) |
How a request travels
Single prices are answered by the API pods. Books are split into tasks on a Redis Stream that intraday workers consume; exposure runs go to a separate batch stream and pool. A counter-based random number generator, seeded from each request's hash, makes every price reproducible on any pod, so caching is safe, any split across workers is exact, and a task re-run after a crash gives the same answer.
flowchart LR
  C[Traders, e-trading, risk] -->|/price · /portfolio/price · /risk/exposure| API[API pods
FastAPI + Pydantic
C++ via pybind11]
  API <-->|cache, locks| R[(Redis
AOF on a volume)]
  API -->|intraday tasks| R
  API -->|batch tasks| R
  R -->|lag drives KEDA| WI[Intraday pool 2-8]
  R -->|lag drives KEDA| WB[Batch pool 0-6]
  WI & WB -->|results| R
  API -. write-behind .-> CS[(Cassandra ring
3 nodes, RF 3)]
  WI -. write-behind .-> CS
  API & WI & WB -. metrics, traces .-> O[Prometheus · Alertmanager
Grafana · Jaeger]
Chaos: kill everything, keep pricing
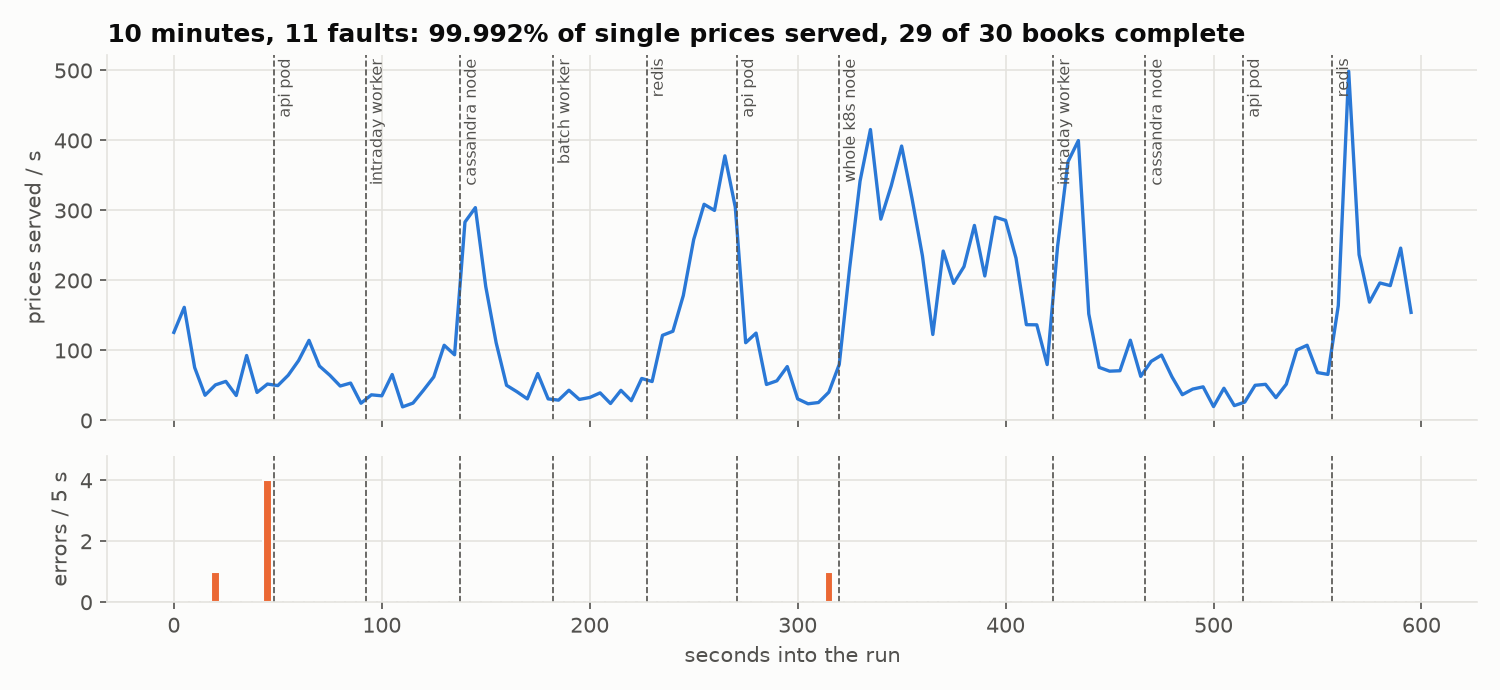
Ten minutes of realistic load (continuous single prices, a 2,000-trade book every 15 seconds, an exposure run every 150 seconds) while a schedule of 11 faults hits the system: API pods, intraday and batch workers, a Cassandra node and Redis are SIGKILLed, and one whole Kubernetes node is stopped for two minutes.
| Result | Value | Why it holds |
|---|---|---|
| Single prices served | 99.992% (6 errors in 76,481) | Readiness drops dead pods, stateless pods leave a lost node after 30 s, circuit breakers skip a dead Redis |
| Books completed | 29 of 30 (3 retried) | Tasks of a killed worker are reclaimed with XAUTOCLAIM; books are idempotent, so a connection-level failure is retried once |
| Trades failed in completed books | 0 of 58,000 | Results are written before the ack; a re-run task gives the same price |
| Exposure runs | 4 of 4, bit-identical | Counter-based RNG: scenario i is the same on any worker; Redis keeps the queue on an append-only file |
| Cassandra node killed | 0 failed writes | Replication factor 3, writes at LOCAL_QUORUM, token-aware driver |
Found by the chaos runs, then fixed. An earlier run lost 3 books at the connection level in the ~50 s before Kubernetes declared a stopped node NotReady (fix: an idempotent client retry). Another showed that the monitoring had died with the node it was watching, so the node alert never fired (fix: the observability stack moved to the control plane). Still open: 1 of 30 books failed on both attempts, with connection resets while the node was down; the next step is resubmitting by job id rather than retrying the HTTP call. Alerts that fired in this run, each routed to its owner:
CassandraReplicaDown→ databaseNodeNotReady→ platformPodRestarting→ coreRedisCircuitOpen→ platform
See it, measure it, route it
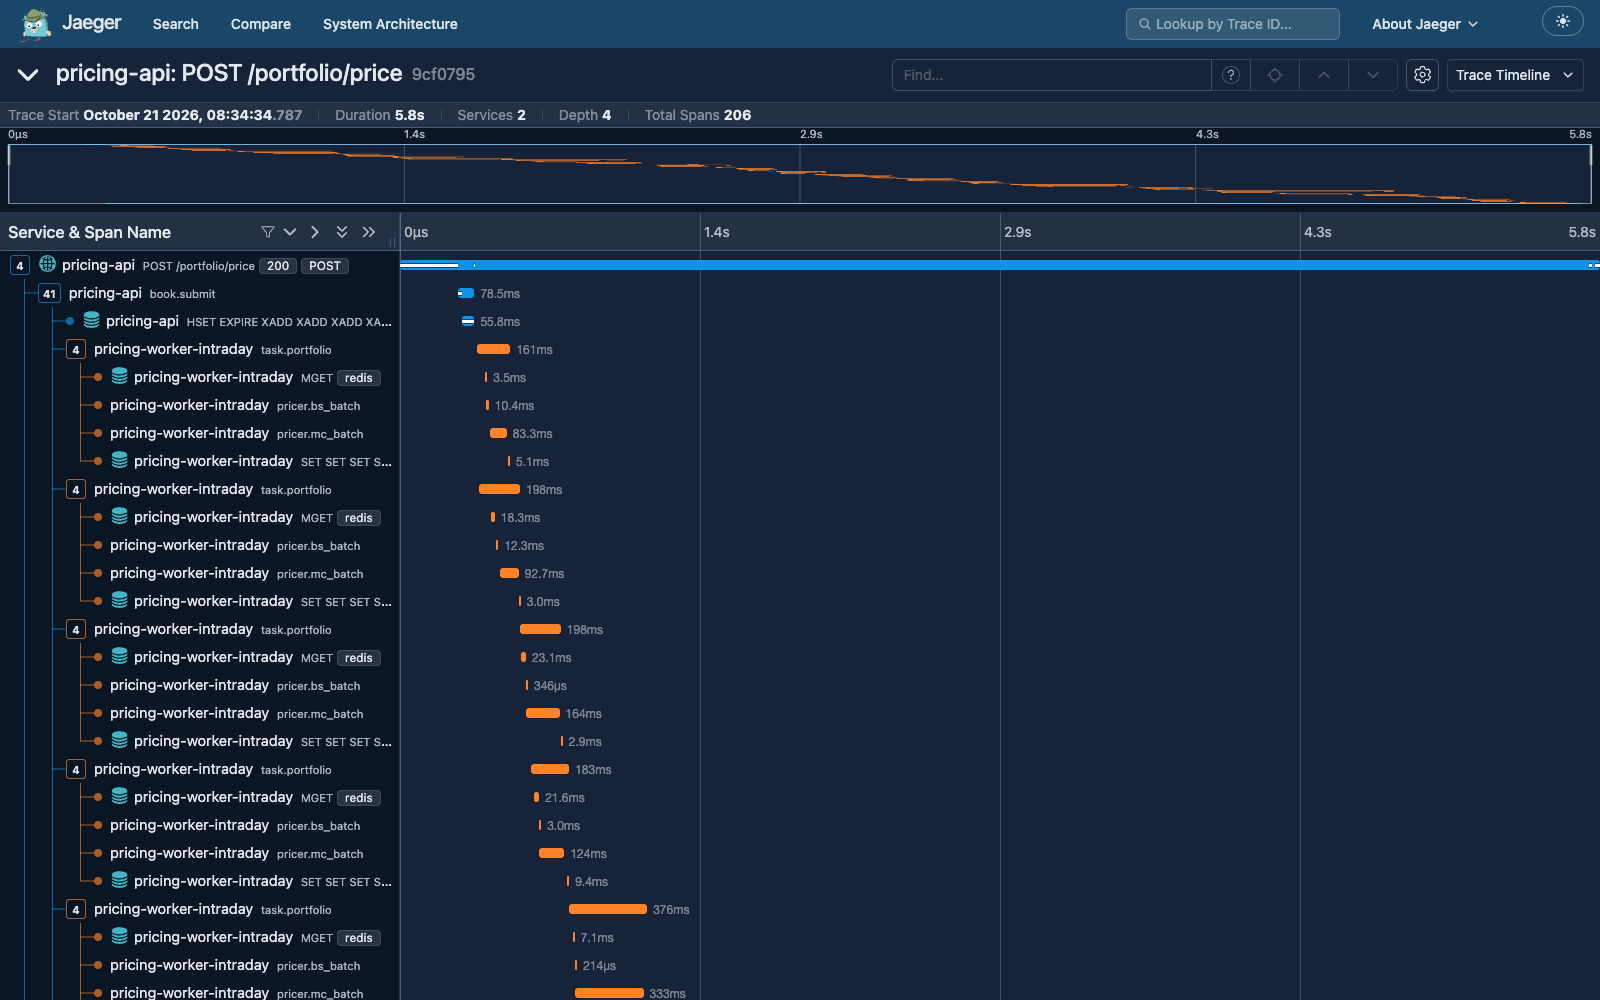
OpenTelemetry traces follow a request across processes: the trace context travels inside each Redis Stream message, so one book is one trace across the API and every worker that priced it. SLOs (99.9% availability, 99% of prices under 250 ms) are watched with multi-window burn-rate alerts, and every alert carries an owner that Alertmanager routes on: core engineering, database, platform or quant.
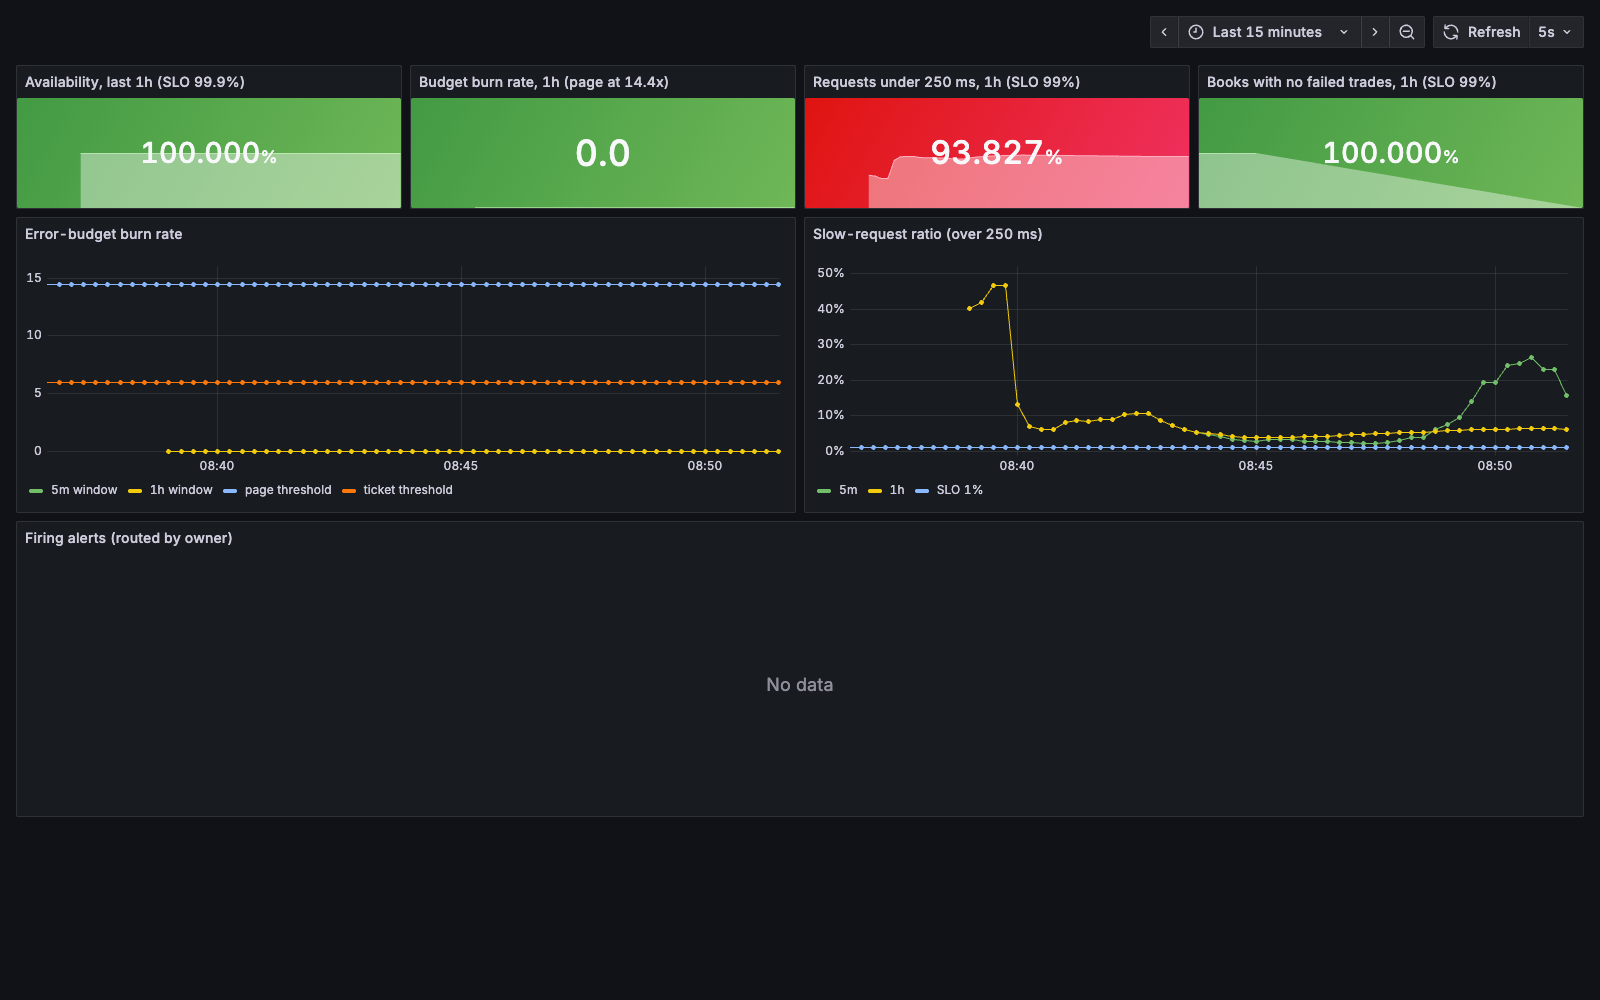
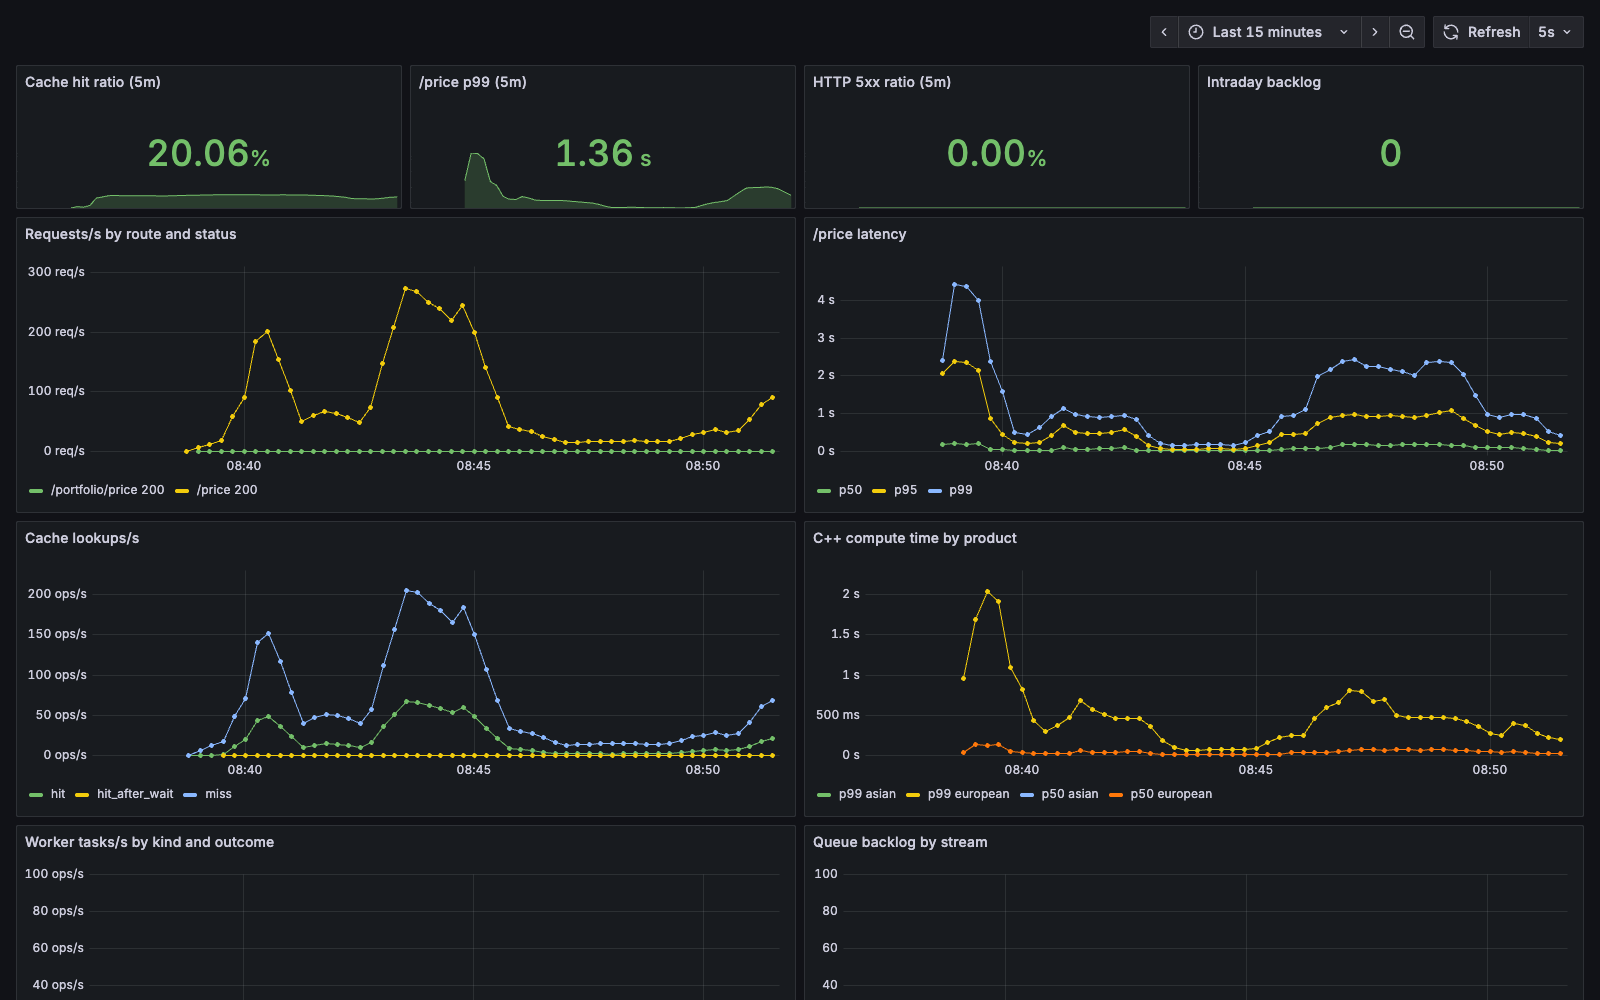
One node down, seen from every angle
A worker node stopped under load. Kubernetes marks it unreachable and evicts its stateless pods after 30 s; the monitoring, which runs on the control plane, keeps watching.
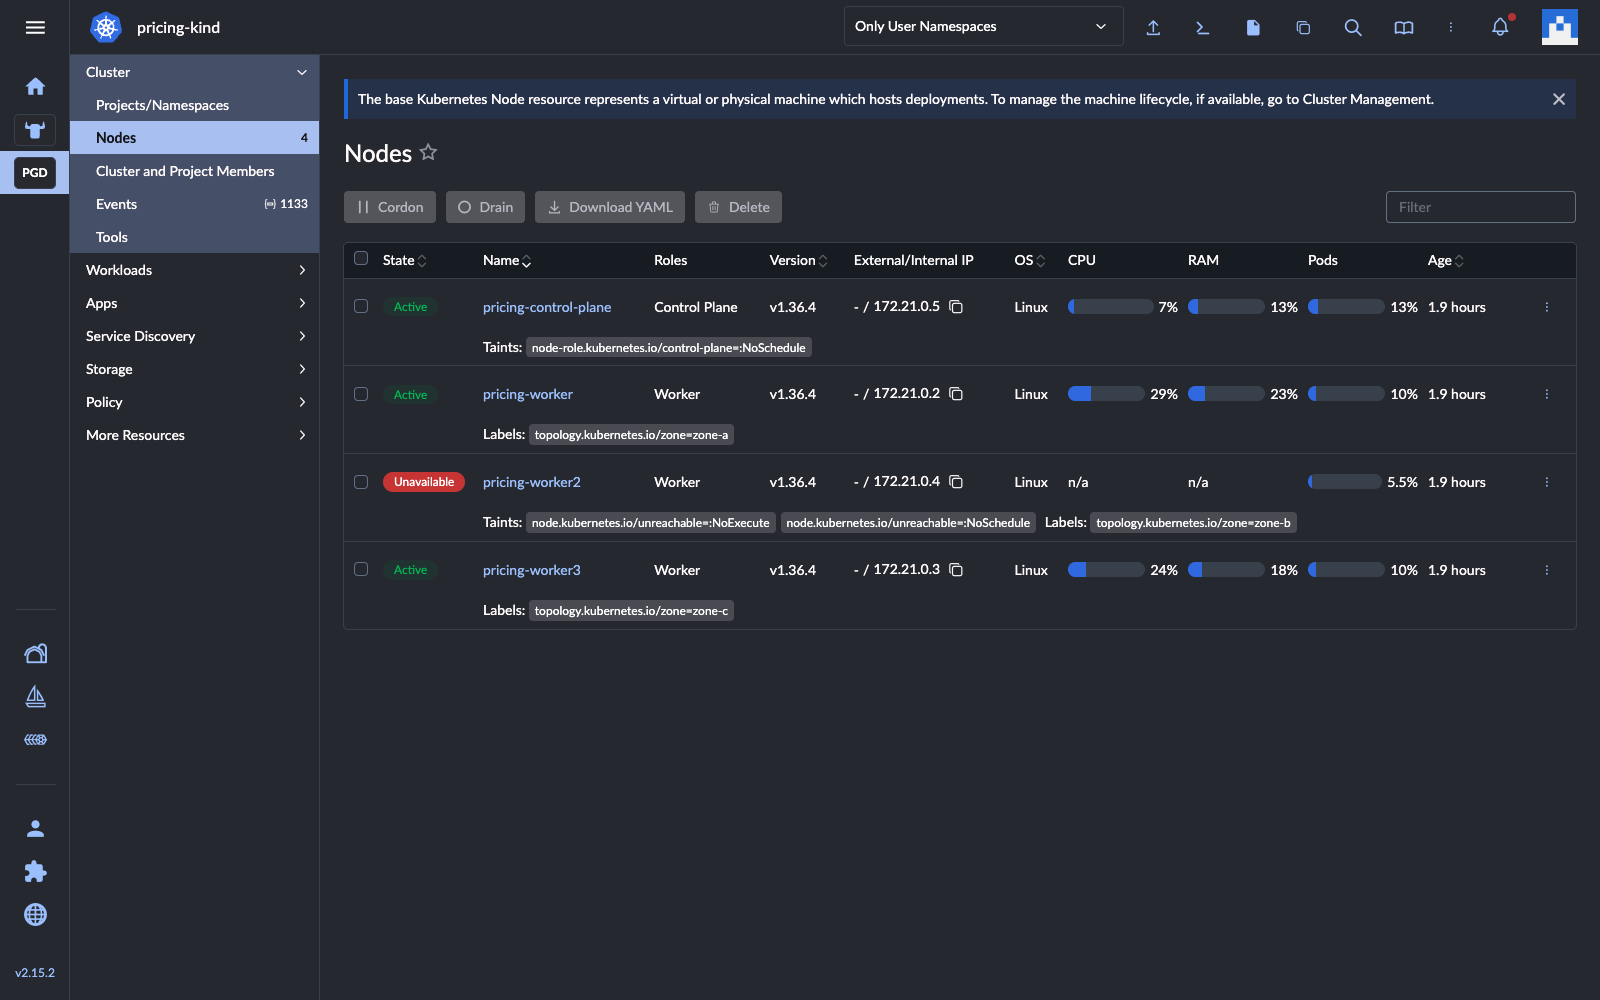
pricing-worker2 Unavailable, tainted unreachable, so nothing new lands on it.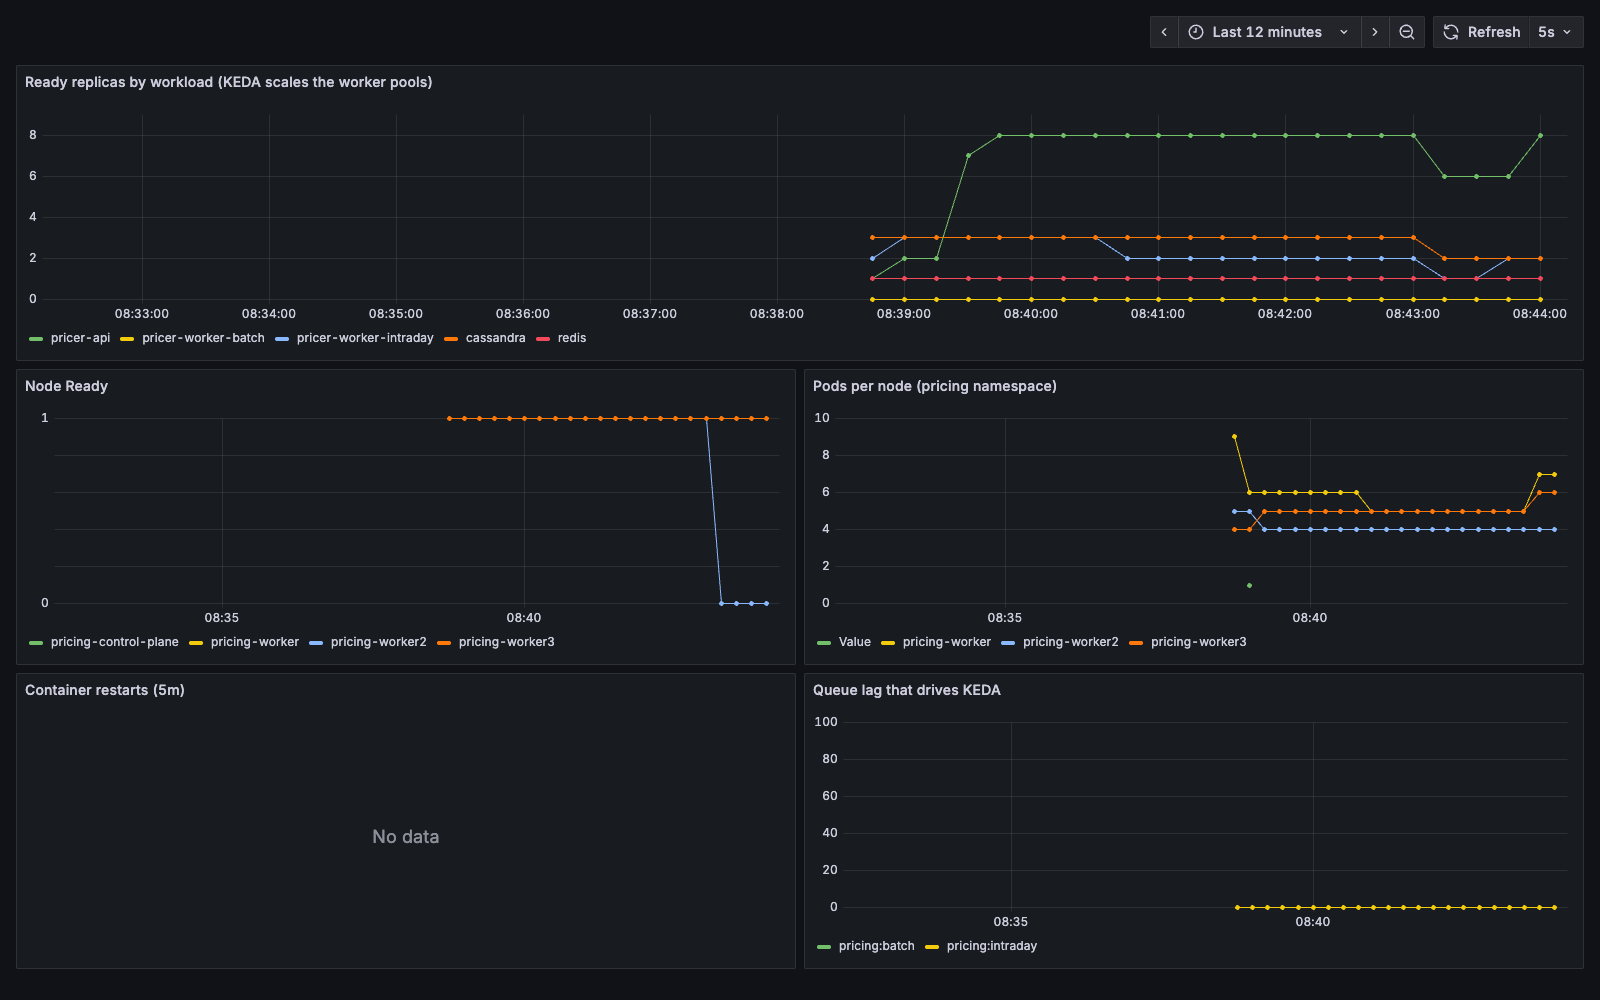
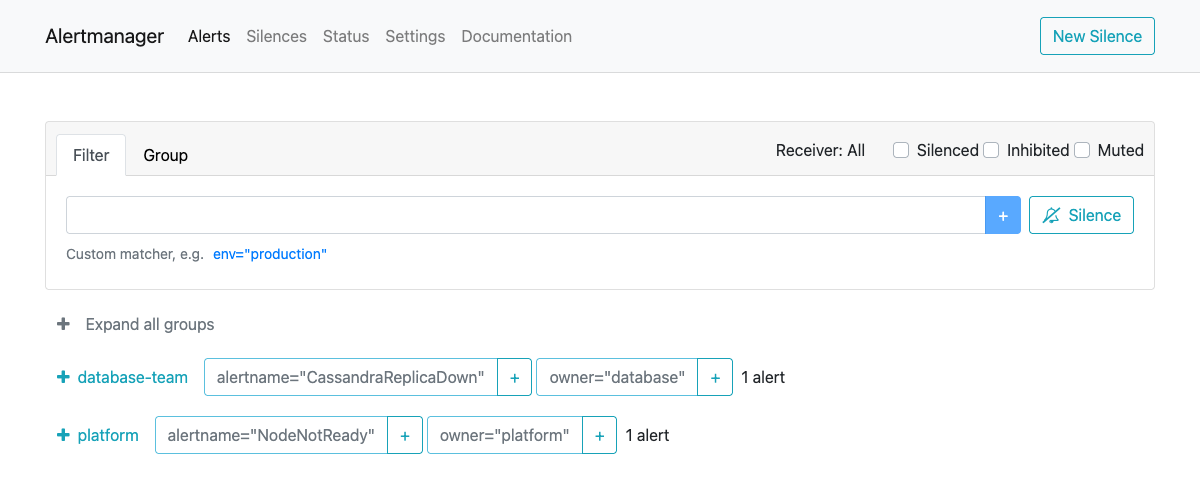
NodeNotReady goes to platform, CassandraReplicaDown to the database team. The backlog alerts the outage would cause are inhibited.Spreading the work, protecting the latency
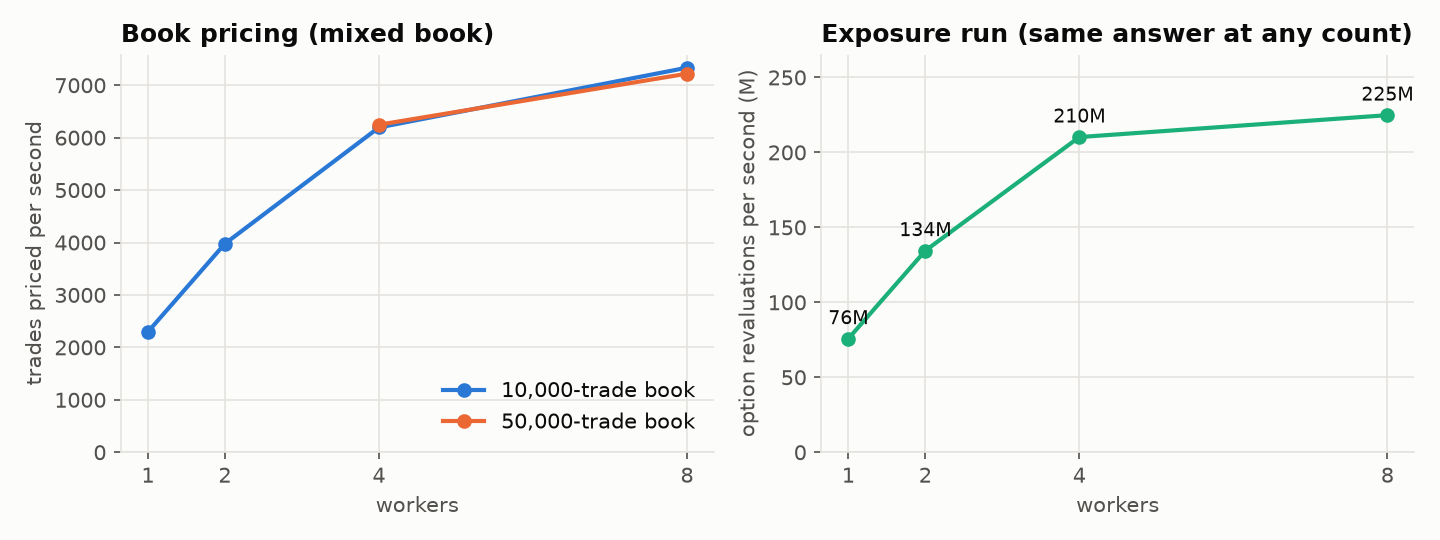
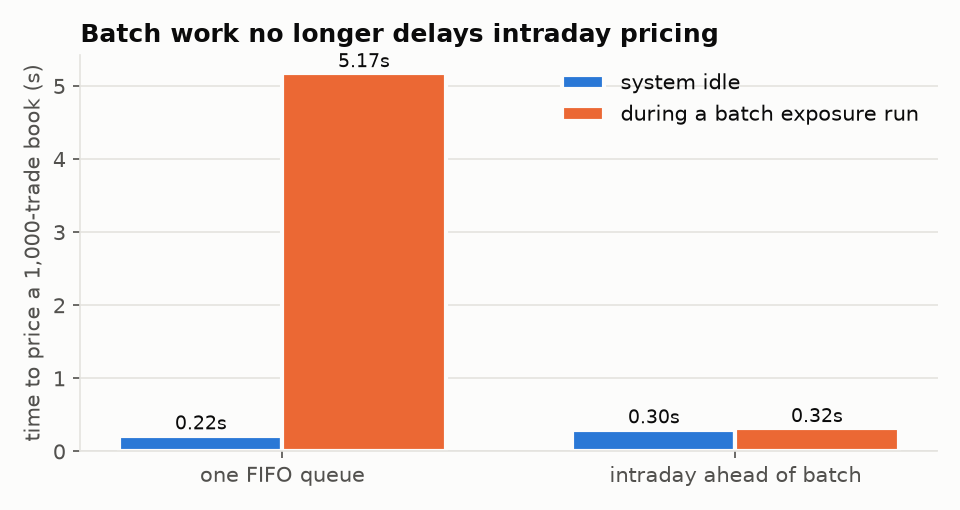
- Autoscaling on the right signal. KEDA sizes each worker pool on its stream's lag, which leads CPU. The batch pool idles at zero; a cold start cost 10 s before the first worker was ready (38 s run vs 9 s warm), which is the price of not keeping batch capacity idle.
- Redis as cache (versioned keys, stampede lock), work queue (Streams, consumer groups, reclaim, poison handling) and job state, with an append-only file so queued work survives a restart.
- Cassandra modelled one table per query (price log by day, job runs by day, exposure runs by netting set), written concurrently and idempotently, behind a write-behind queue so pricing never waits on it.
C++, pybind11 and memory
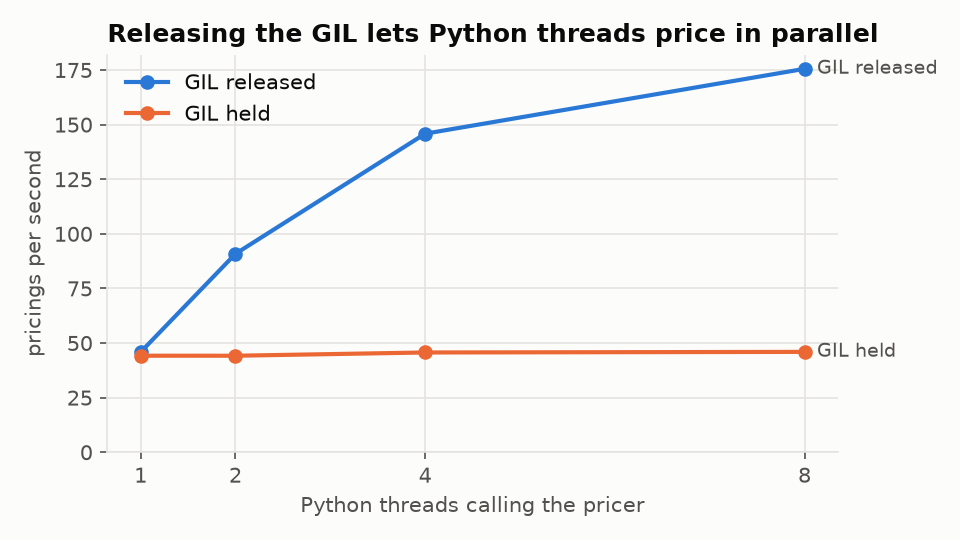
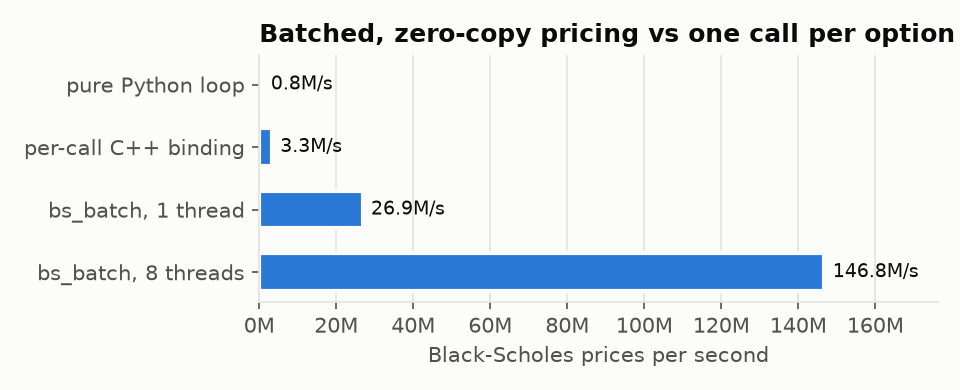
- Philox counter-based RNG checked against published test vectors; results are bit-identical for any thread count.
- RAII, cache-line-aligned scratch (no false sharing), no allocation per path (a test counts
operator new), exceptions carried safely across threads. - AddressSanitizer, UBSan, ThreadSanitizer and Valgrind clean, including Valgrind on the Python extension, which loses nothing per call.
- Variance reduction as a performance tool: the Asian control variate cuts variance 1,009×, so 198 paths match 200,000.
Run the whole thing locally
make cluster   # 4-node kind cluster, KEDA, the app and its observability stack
make rancher   # Rancher, with the cluster imported
make demo      # guided walkthrough: prices, a 10,000-trade book, an exposure run, a failure, triage
make chaos     # the 10-minute chaos run
Limits, plainly: everything runs on one laptop, so scaling numbers show the mechanics rather than cluster capacity; the models are textbook (GBM, flat curves, no collateral in the exposure run); the prod overlay is validated but has not run on a production cluster.